2023 A Year of Challenges
2023: A Year of Challenges

In terms of commercial real estate, many dire predictions were made in early 2023. It appeared that employees working at home might become the new normal of the post-pandemic era. Moreover, a variety of tech and other companies, especially in San Francisco, downsized or relocated their offices in the face of economic demands. Last year was somewhat challenging for Hacienda but ended on a more encouraging note. Northern California’s largest mixed-use development has faced worse since its creation in the 1980s and has historically rebounded after every market downturn.
While quarter-over-quarter figures showed a slight decrease in availability, going from 15.76% in the third quarter to 15.73% in the fourth quarter, the results for the year saw a negative 165,851 square feet of net absorption. December saw an increase in occupancy, which hopefully heralds more good news at the start of 2024; the total occupancy in December came to 6,854,674 square feet, which is a 27,466 square-foot increase from the previous month. Overall, the monthly occupancy in January 2023 kicked off the year at 7,028,641 square feet and fluctuated slightly over the course of the year, bottoming out at 6,827,208 in November.
Most of that activity came from tenants occupying less than 10,000 square feet, which accounted for 80.85% of all transactions and 33.85% of the total volume of occupied space. Conversely, 19.15% of deals were in larger spaces between 10,000 and 50,000 square feet, accounting for 66.15% of all space occupied during the year. In 2023, the business services sector comprised the largest portion of Hacienda’s occupied space, at 1,523,088 square feet. Biomedical companies accounted for 1,121,006 square feet, software development occupied 553,154 square feet, and manufacturing took up 498,570 square feet. Other notable industries at Hacienda last year included retail, hotels, health, education, and consumer goods, providing a diverse group of tenants that reflects the wealth of employment opportunities across the Bay Area. The following tables provide a general overview of activity in Hacienda during 2023, including highlights of selected projects at various sites, tenant activity, and property sales.
2023 Development Activity (Approved, Under Construction, or Completed)
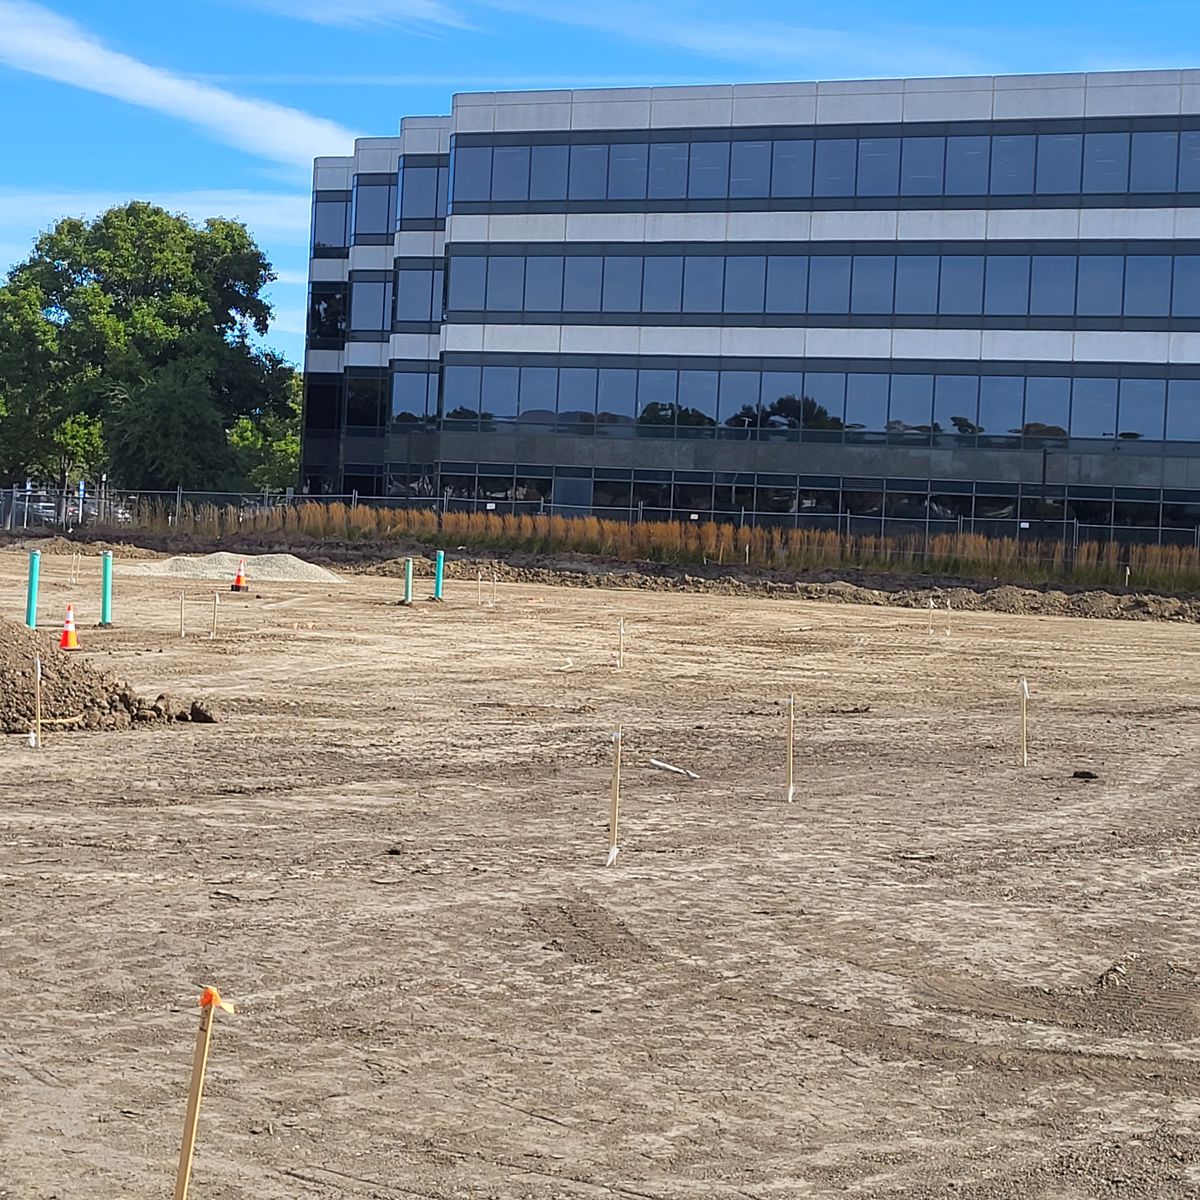
A number of important projects were advanced at existing facilities at various locations. These projects included a variety of site and building improvements, some performed to accommodate new tenants such as Unchained Labs at the project at 4747 Willow Road. Below is a selection of the major work undertaken at Hacienda during the past twelve months.
| Location | Activity |
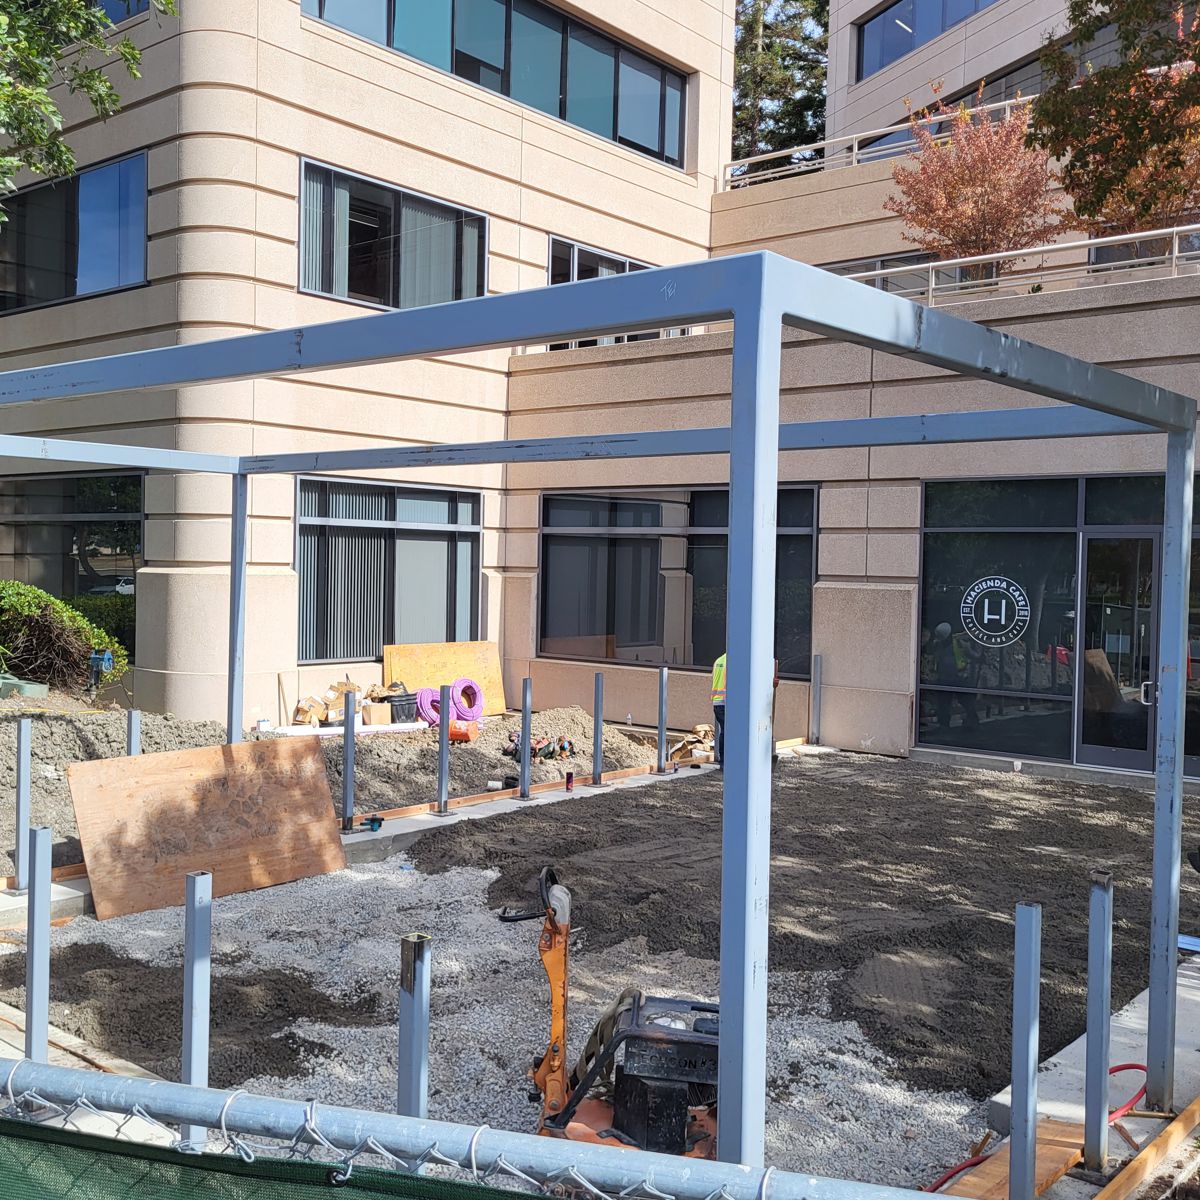
| Platform Center | Outdoor tenant amenity area |
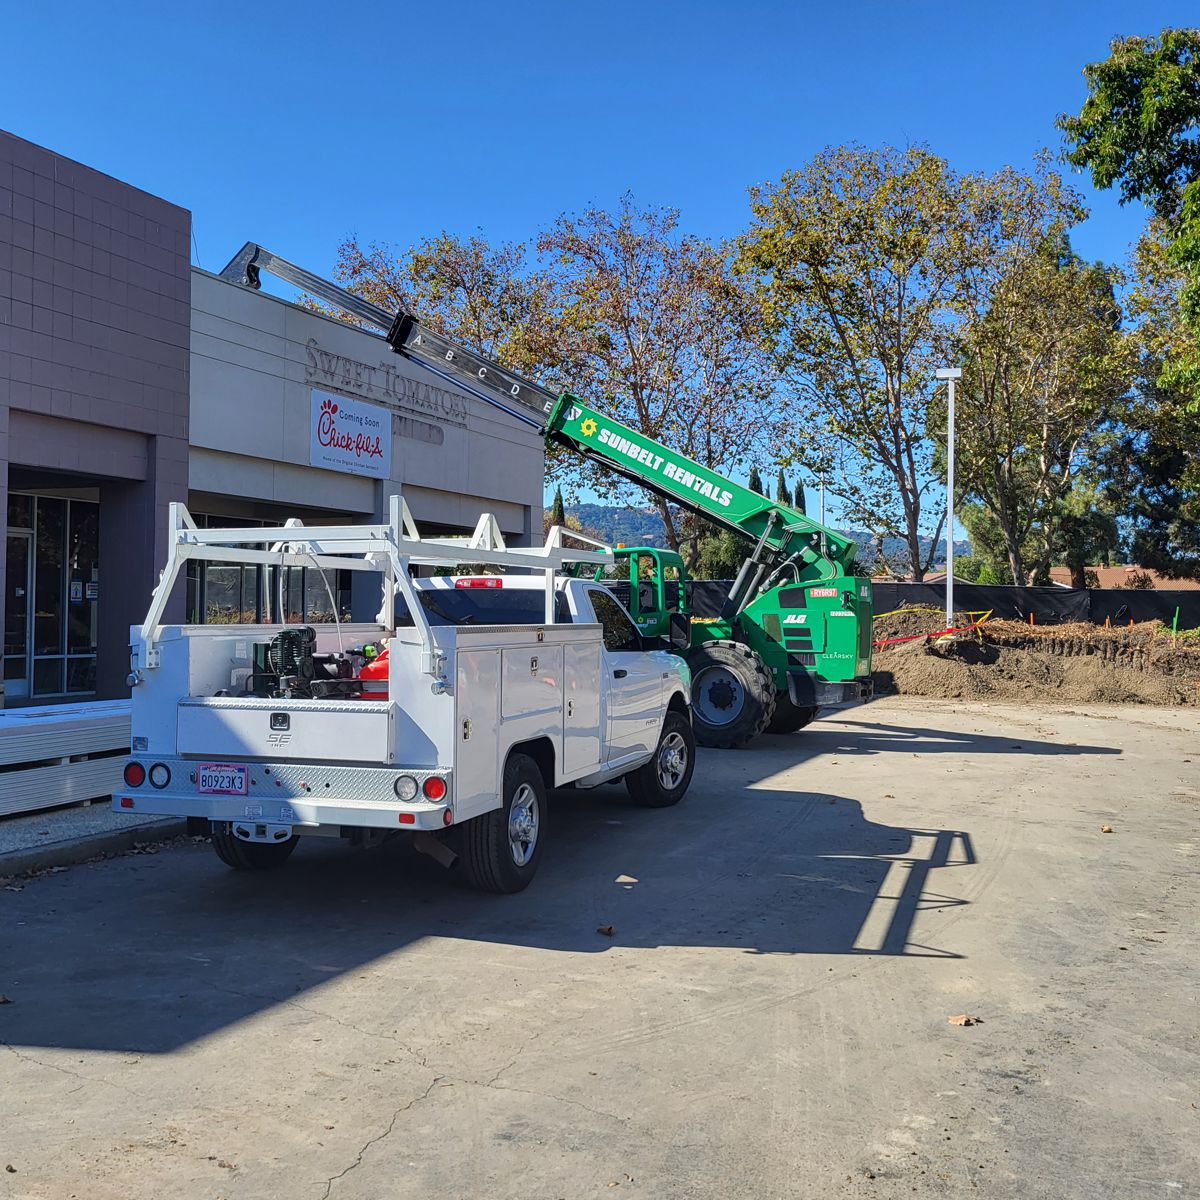
| Crossroads Center | Space and site reconfiguration for Chick-Fil-A |
| Hacienda Terraces | Outdoor tenant amenity area |
| Pleasanton Labs | Space reconfiguration and site upgrades for existing and future tenants |
| 4747 Willow Road | Space and site reconfiguration for Unchained Labs |
| Arroyo Center | Space and site reconfiguration for Pleasanton Unified School District |
| Rosewood Commons | Parking area reconfiguration |
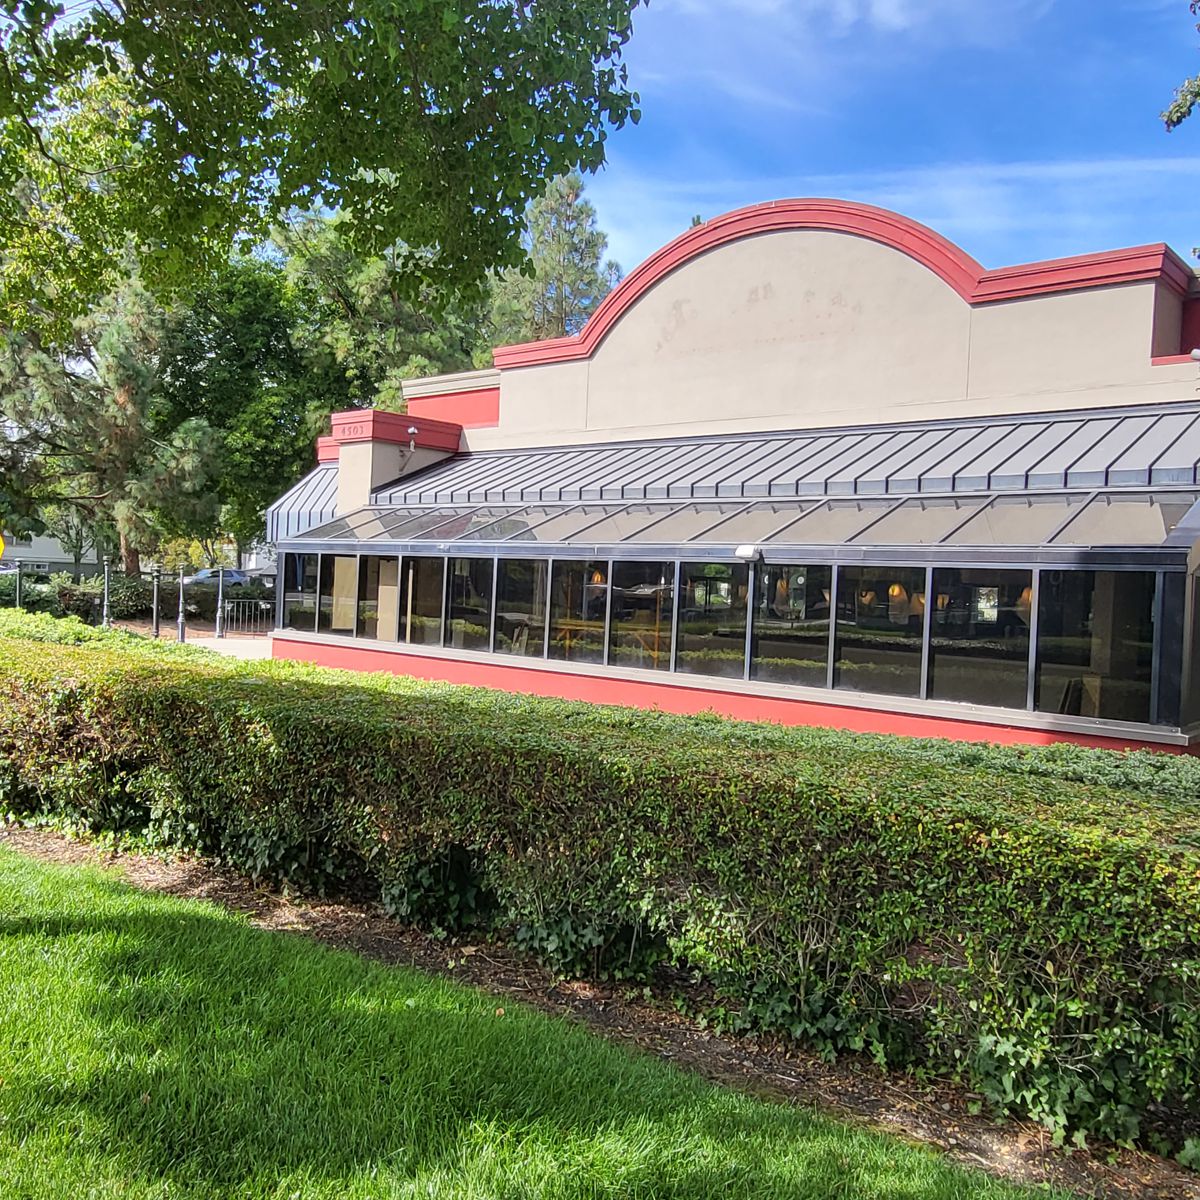
| Metro 580 | Space reconfiguration for Denica's |
| Amador One | Rooftop solar installation |
Major Tenant Activity
Notable tenants that leased space at Hacienda last year included ADP, Shea Homes, Regional Parks Foundation, Walovich Architects Group, and Inneos. Hacienda saw just over 280,000 square feet of activity in 2023. The majority of transactions involved less than 10,000 square feet. ADP, at close to 24,000 square feet of activity, was the exception to that trend.
| Company | Size | Address |
| Walovich Architechs Group | ~ 5,600 | 3875 Hopyard Road |
| Natus Medical Incorporated | ~ 7,200 | 5627 Stoneridge Drive |
| MISCO Water | ~ 3,900 | 3825 Hopyard Road |
| Regional Parks Foundation | ~ 4,700 | 5653 Stoneridge Drive |
| ADP | ~ 23,500 | 4410 Rosewood Drive |
| Performant Financial | ~ 7,400 | 4309 Hacienda Drive |
| Inneos, LLC | ~ 11,200 | 4255 Hopyard Road |
| Denica's Real Food Kitchen | ~ 7,200 | 4503 Rosewood Drive |
| Shea Homes | ~ 10.400 | 4305 Hacienda Drive |
| Size (sf) | Transaction Volume (%) | Space Absorbed (%) |
| < 10K | 80.85 | 33.85 |
| 10K-50K | 19.15 | 66.15 |
| > 50K | 0 | 0 |
| Vacancy Rates At Year End (%) | Office | Flex/R&D | Retail | Warehouse | Total |
| 2023 | 21.03 | 6.25 | 6.52 | 0 | 15.73 |
2023 Sales Activity
Standing in stark contrast to 2022, no sales occurred during 2023. While a number of sales were transacted for both users and investors during the prior year, neither of these groups produced sales activity during 2023. If expected changes occur related to capital availability and the cost of financing improves in the coming year, sales activity is expected to resume.


